Overview of ROSeq
The ROSeq package evaluates differential expression between two subpopulations of single cells. Modeling single cell expression is challenging due to high noise levels and technical bias. We conjectured that considering ranks instead of absolute expression estimates would make a model less susceptible to the noise and the technical bias. ROSeq obtains a good overall fit in modeling the probability distribution of ranks across genes. The Wald’s test is subsequently used to probe into differential expression across cell sub-types. When applied on real data-sets, ROSeq performs competitively compared to the state of the art methods.
The overall approach to the differential expression analysis is detailed in the following publication: “ROSeq: A rank based approach to modeling gene expression in single cells” (Lalit M, Biswas A, Ghosh A and Sengupta D)
For additional installation information, tutorials, and more, please visit the ROSeq website ☞
ROSeq - A rank based approach to modeling gene expression in single cells
ROSeq evaluates differential expression between two subpopulations of single cells by modeling the rank distribution of read counts for each gene.
Abstract
Single cell transcriptomics provides a window into cell-to-cell variability in complex tissues. Modeling single cell expression is challenging due to high noise levels and technical bias. In the past few years, considerable efforts have been made to devise suitable parametric models for single cell expression data. We use Discrete Generalized Beta Distribution (DGBD) to model the probability distribution of ranks, corresponding to the read counts for a gene and subpopulation. Use of DGBD yields better overall fit across genes compared to the widely used mixture model comprising Poisson and Negative Binomial density functions. Further, we use Wald’s test to probe into differential expression across cell sub-types. We package our implementation as a standalone software called ROSeq. When applied on real data-sets, ROSeq performed competitively compared to the state of the art methods including MAST, SCDE and ROTS.
Downloads
The Research Article and Supplementary Material is available for download here.
The R code used for producing differential analysis with methods like SCDE, ROTS, MAST and Wilcoxon-Rank Sum is also available for download in the directory “04_R_code.zip”, which is found in the Release section of the repository, in case one wishes to reproduce the results.
Getting Started
As a first step, download the complete ROSeq repository on to your PC. This would provide the files needed to run the Tutorial Below.
Also, go to the Release Section of the repository and download the executables specific to your operating system. Support is provided for Windows, macOS and Linux. Once the zip folder has been downloaded, extract it to a desirable location. Next, open the for_redistribution directory and double click the executable file within to begin the installation process.
Tutorial
This tutorial below, provides instructions to upload the (un) normalized read count data corresponding to single cells coming from the individuals NA19098 and NA19101, in the tung2017 data set; and subsequently analyse the two subpopulations for differential expression.
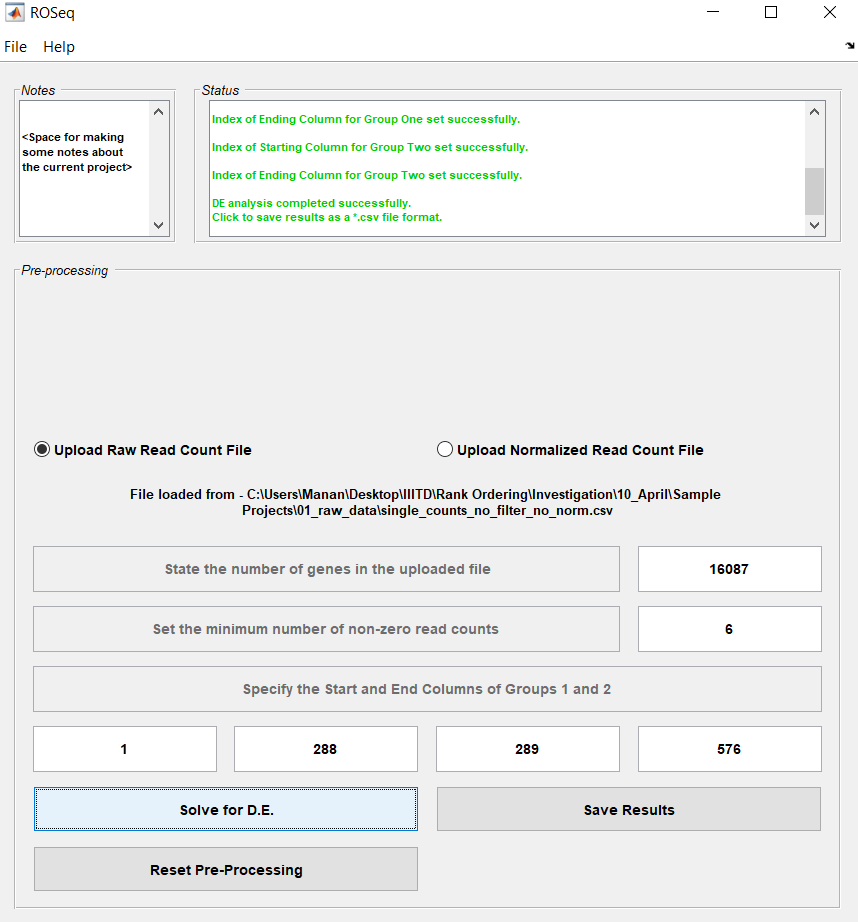
The number of single cells equals 288 for each individual. After filtering with a threshold equal to six, low quality genes are eliminated and the number of genes considered for differential expression analysis reduces from 19027 to 16087. This is also prompted as a message in the Status Panel.
Following would constitute as a complete set of steps from uploading read count data to saving results as a ‘*.csv’ file:
-
Click on the radio button - Upload Raw Read Count file. This would produce an Open File button, for the user to upload the respective file.
-
Click on the Open File button, to select the raw read count file single_counts_no_filter_no_norm.csv. Prior to successful selection of the file, an import wizard window would appear. Click on the buttons Next and Finish.
-
Next, the number of genes in the uploaded file will be suggested (19027). The user could alter the number of genes, in case you wish to look only at the first few (10) genes.
-
Decide on the Filter Threshold. A filter threshold equal to 6, would mean that all genes with the number of non-zero read counts less than 6, would not be considered during the subsequent differential analaysis, as they would be considered low-quality genes.
-
Select the starting (1) and ending (288) column index corresponding to the first group (NA19098). Select the starting (289) and ending (576) column of the second group similarly (NA19101).
-
If all steps were performed so far, then the Solve DE Button becomes enabled. Click on it to run the analysis for differential expression. This would open up a green progress bar for the Subpopulation One, followed by another for Subpopulation Two.
-
Once the analysis is complete, a message (DE analysis completed successfully.) would appear in the Status Panel. At this stage, the ROSeq software would look as in the Figure below.
-
Lastly, click on Save Results button to save the variables [pValue, adjusted pValue and log2(fold count)] as three columns in a *.csv file format.
Datasets
The tung2017 dataset was downloaded from jdblischak’s Repository. Bulk RNA-seq read count data was extracted from bulk_reads_per_sample.txt, while single cell RNA-seq read count data was extracted from molecules.txt. (See R code in the Release Subsection of the repository.)
Troubleshooting
In case of any issues or to dive deeper into the implementation, please access the original MATLAB code which has been used to build the Graphical Interface. The file initializeGUI.m, available in the directory 03_matlab_files is the entry point to the code. Run this file (press F5 button) and debug! If the problem is not solved through this approach, please feel free to start an issue here.